In several of my recent presentations, I’ve discussed the lifetime of security flaws in the Linux kernel. Jon Corbet did an analysis in 2010, and found that security bugs appeared to have roughly a 5 year lifetime. As in, the flaw gets introduced in a Linux release, and then goes unnoticed by upstream developers until another release 5 years later, on average. I updated this research for 2011 through 2016, and used the Ubuntu Security Team’s CVE Tracker to assist in the process. The Ubuntu kernel team already does the hard work of trying to identify when flaws were introduced in the kernel, so I didn’t have to re-do this for the 557 kernel CVEs since 2011.
As the README details, the raw CVE data is spread across the active/, retired/, and ignored/ directories. By scanning through the CVE files to find any that contain the line “Patches_linux:”, I can extract the details on when a flaw was introduced and when it was fixed. For example CVE-2016-0728 shows:
Patches_linux:
 break-fix: 3a50597de8635cd05133bd12c95681c82fe7b878 23567fd052a9abb6d67fe8e7a9ccdd9800a540f2
This means that CVE-2016-0728 is believed to have been introduced by commit 3a50597de8635cd05133bd12c95681c82fe7b878 and fixed by commit 23567fd052a9abb6d67fe8e7a9ccdd9800a540f2. If there are multiple lines, then there may be multiple SHAs identified as contributing to the flaw or the fix. And a “-” is just short-hand for the start of Linux git history.
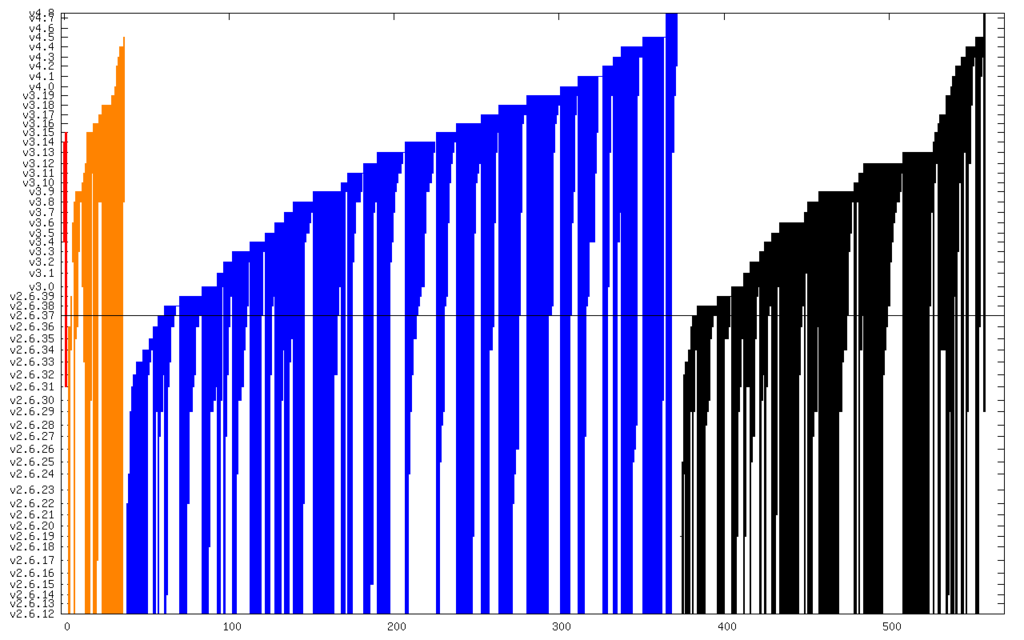
Then for each SHA, I queried git to find its corresponding release, and made a mapping of release version to release date, wrote out the raw data, and rendered graphs. Each vertical line shows a given CVE from when it was introduced to when it was fixed. Red is “Critical”, orange is “High”, blue is “Medium”, and black is “Low”:
And here it is zoomed in to just Critical and High:
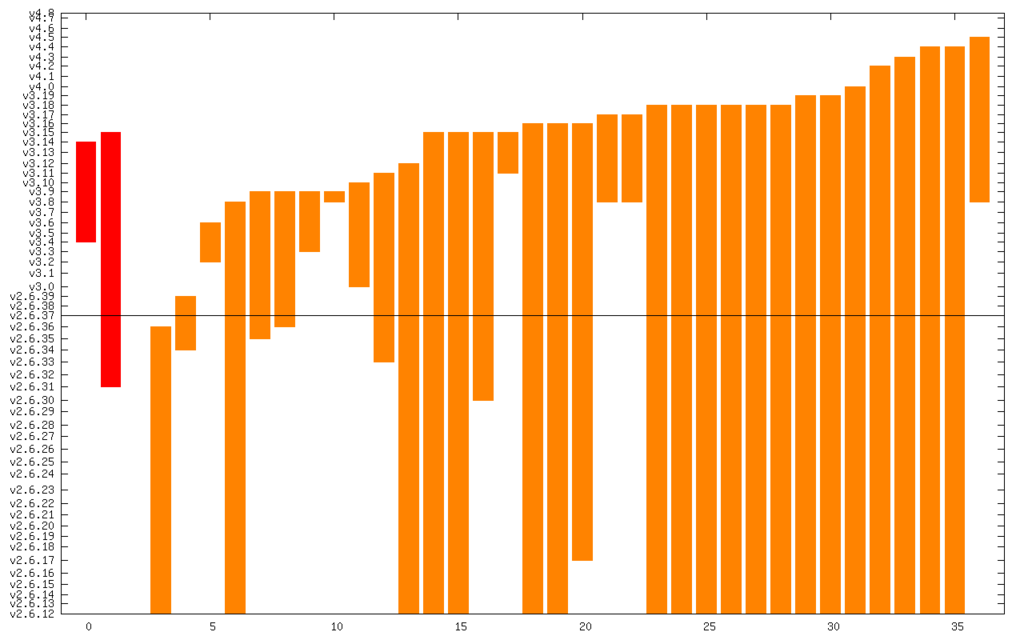
The line in the middle is the date from which I started the CVE search (2011). The vertical axis is actually linear time, but it’s labeled with kernel releases (which are pretty regular). The numerical summary is:
- Critical: 2 @ 3.3 years
- High: 34 @ 6.4 years
- Medium: 334 @ 5.2 years
- Low: 186 @ 5.0 years
This comes out to roughly 5 years lifetime again, so not much has changed from Jon’s 2010 analysis.
While we’re getting better at fixing bugs, we’re also adding more bugs. And for many devices that have been built on a given kernel version, there haven’t been frequent (or some times any) security updates, so the bug lifetime for those devices is even longer. To really create a safe kernel, we need to get proactive about self-protection technologies. The systems using a Linux kernel are right now running with security flaws. Those flaws are just not known to the developers yet, but they’re likely known to attackers, as there have been prior boasts/gray-market advertisements for at least CVE-2010-3081 and CVE-2013-2888.
(Edit: see my updated graphs that include CVE-2016-5195.)
© 2016, Kees Cook. This work is licensed under a Creative Commons Attribution-ShareAlike 4.0 License.
I would like to see the same for FreeBSD.
Comment by wviana — October 19, 2016 @ 4:33 am
Taking the average sometimes misleads people so I was wondering about the actual distribution and made a histogram here:
http://imgur.com/a/Zlklq
Not bell-shaped. It looks like the most probably year of fixing is the first, followed by the eight.
Comment by Ole Laursen — October 19, 2016 @ 4:49 am
“Those flaws are just not known to the developers yet, but they’re likely [citation needed] known to attackers.”
Comment by Jasper Bryant-Greene — October 19, 2016 @ 7:03 am
Added citations for some known 0-days. Attackers having exploits is not a theoretical concern.
Comment by kees — October 20, 2016 @ 2:44 pm
The histogram is interesting, and I think it’s mostly showing an inverted bell curve with the forward and rear peaks being “noticed quickly” and “noticed very late”. :P
Comment by kees — October 20, 2016 @ 2:53 pm
Really interesting distribution, looks to me like it might be the sum of an exponential decay and a normal distribution. Would be interesting to see if they can be classified into two categories with those separate distribution s
Comment by Nick Moore — October 21, 2016 @ 4:03 pm
I follow up on the comment of Nick Moore. The distribution seems to be the sum of an exponential distribution and a normal distribution with the mean at 9 years past discovery. I think that the exponential distribution is the distribution of the time that it takes to find in the code the cause of bug reports, and the normal distribution may be the distribution of the time that a kernel developer is the developer for a part of the kernel. That is, the normal distribution may be caused by the efforts of the developers who are the successors to the previous developers for parts of the kernel.
Rationale: Assume that the intrinsic difficulty to resolve a bug report is time invariant for any given bug. Also suppose that the technical means to find bugs are time invariant. If the human efforts to resolve bugs would be time invariant, then the time it takes to resolve bugs would have an exponential distribution. That appears to be not the case. Therefore, it must be concluded that the human effort to resolve bugs is time variant. Now suppose that the intelligence, the focus and the sense of responsibility of kernel developers are constants. It follows that the increase in the number of bugs that are resolved after 7 years must be caused by changes in the dedication of developers with respect to kernel parts.
Comment by Maarten — January 13, 2017 @ 9:25 am
My previous comment is based on a major misapprehension. I correct it as follows. The distribution made by Ole Laursen seems to be the sum of an exponential distribution, a mild normal distribution with the mean at 6 years and a second normal distribution with the mean at 9 years. The exponential distribution may be the distribution of the number of vulnerabilities found by the developers who introduced the vulnerabilities. The mild normal distribution with the mean at 6 years may be the distribution of the number of vulnerabilities found by outsiders. The second normal distribution with the mean at 9 years may be the distribution of the number of vulnerabilities found by the developers who are the successors to the developers who introduced the vulnerabilities. (I assume that a developer and his or her successor maintains only a small part of the kernel.)
Comment by Maarten — January 22, 2017 @ 2:55 pm