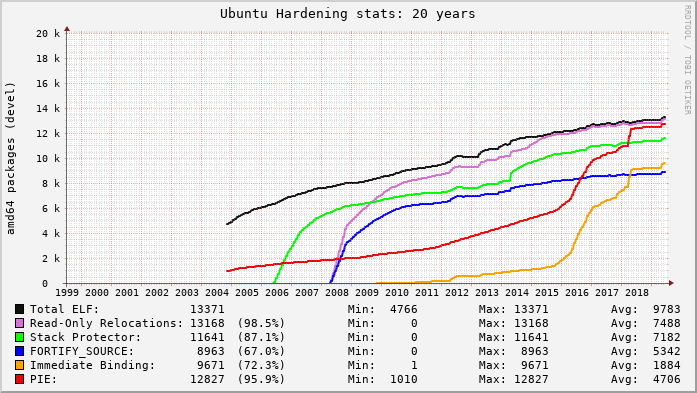
Forever ago I set up tooling to generate graphs representing the adoption of various hardening features in Ubuntu packaging. These were very interesting in 2006 when stack protector was making its way into the package archive. Similarly in 2008 and 2009 as FORTIFY_SOURCE and read-only relocations made their way through the archive. It took a while to really catch hold, but finally PIE-by-default started to take off in 2016 through 2018:

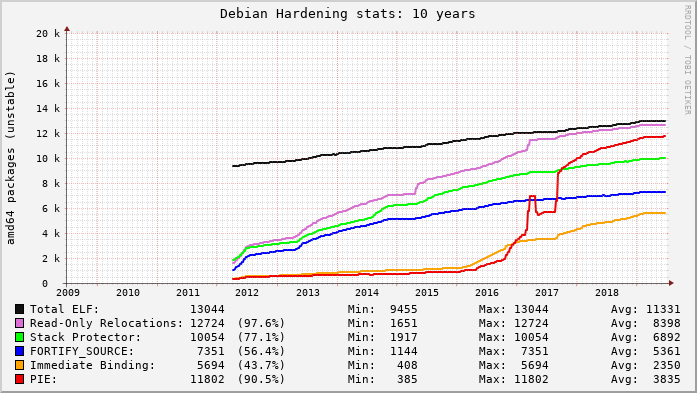
Around 2012 when Debian started in earnest to enable hardening features for their archive, I realized this was going to be a long road. I added the above “20 year view” for Ubuntu and then started similarly graphing hardening features in Debian packages too (the blip on PIE here was a tooling glitch, IIRC):

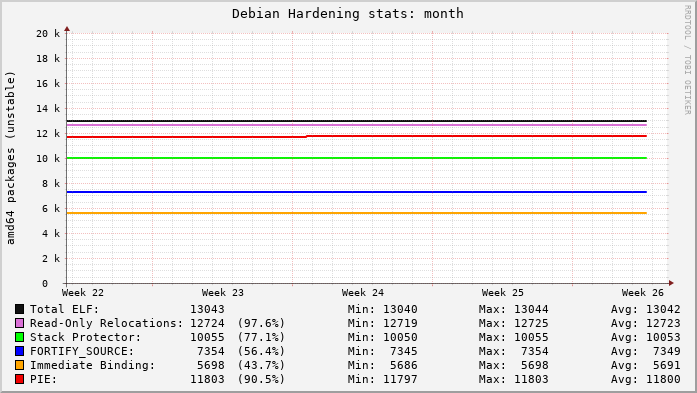
Today I realized that my Ubuntu tooling broke back in January and no one noticed, including me. And really, why should anyone notice? The “near term” (weekly, monthly) graphs have been basically flat for years:

In the long-term view the measurements have a distinctly asymptotic appearance and the graphs are maybe only good for their historical curves now. But then I wonder, what’s next? What new compiler feature adoption could be measured? I think there are still a few good candidates…
How about enabling -fstack-clash-protection (only in GCC, Clang still hasn’t implemented it).
Or how about getting serious and using forward-edge Control Flow Integrity? (Clang has -fsanitize=cfi for general purpose function prototype based enforcement, and GCC has the more limited -fvtable-verify for C++ objects.)
Where is backward-edge CFI? (Is everyone waiting for CET?)
Does anyone see something meaningful that needs adoption tracking?
© 2019, Kees Cook. This work is licensed under a Creative Commons Attribution-ShareAlike 4.0 License.